


 Current location:
NEWS INFORMATION
NEWS INFORMATION
Electric Sightseeing Vehicle: A Sustainable Tourism Solution
author:xuanyue date:2026-06-19 06:33:30 click:169
As the global tourism industry faces mounting pressure to decarbonize operations, the electric sightseeing vehicle has emerged as a transformative solution for resorts, theme parks, historic districts, and tour operators. This comprehensive analysis examines the strategic, economic, and environmental advantages of deploying electric sightseeing vehicles, providing B2B procurement decision-makers with the evidence base necessary for informed investment decisions.
1. Market Dynamics and Growth Drivers
The electric sightseeing vehicle market is experiencing robust growth, projected to expand from $1.2 billion in 2023 to $2.8 billion by 2030 (CAGR 12.9%, MarketsandMarkets 2023). Key growth drivers include:
Regulatory Push: Emission-free zones in historic city centers (Rome, Barcelona, Kyoto) mandate electric propulsion for tour vehicles
Corporate Sustainability Commitments: Major hotel chains (Marriott, Hilton, Accor) have pledged 30-50% emission reductions by 2030, driving electric fleet adoption
Visitor Preferences: 73% of millennial and Gen Z travelers prefer eco-certified tourism experiences (Booking.com, 2023), creating market demand for sustainable sightseeing options
Total Cost of Ownership (TCO) Parity: Electric electric sightseeing vehicle models now achieve TCO parity with gasoline equivalents within 2-3 years of operation
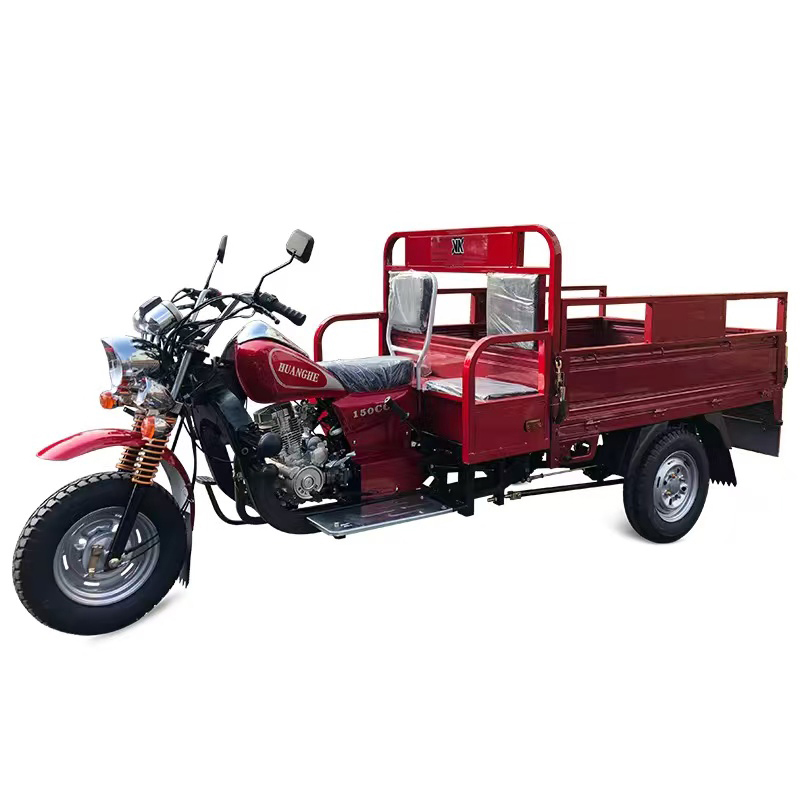
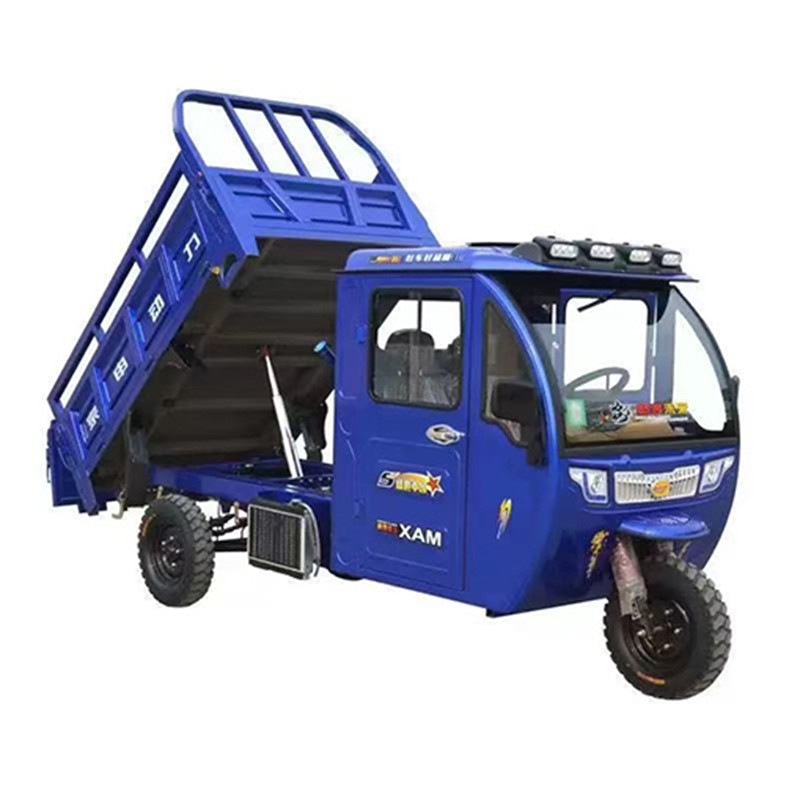
2. Vehicle Categories and Specifications
The electric sightseeing vehicle market encompasses several distinct categories:
| Vehicle Category | Seating Capacity | Range per Charge | Typical Use Case | Price Range |
|---|---|---|---|---|
| Electric Shuttle (Low-Speed) | 6-14 seats | 60-100 km | Resort shuttles, campgrounds | $8,000 - $18,000 |
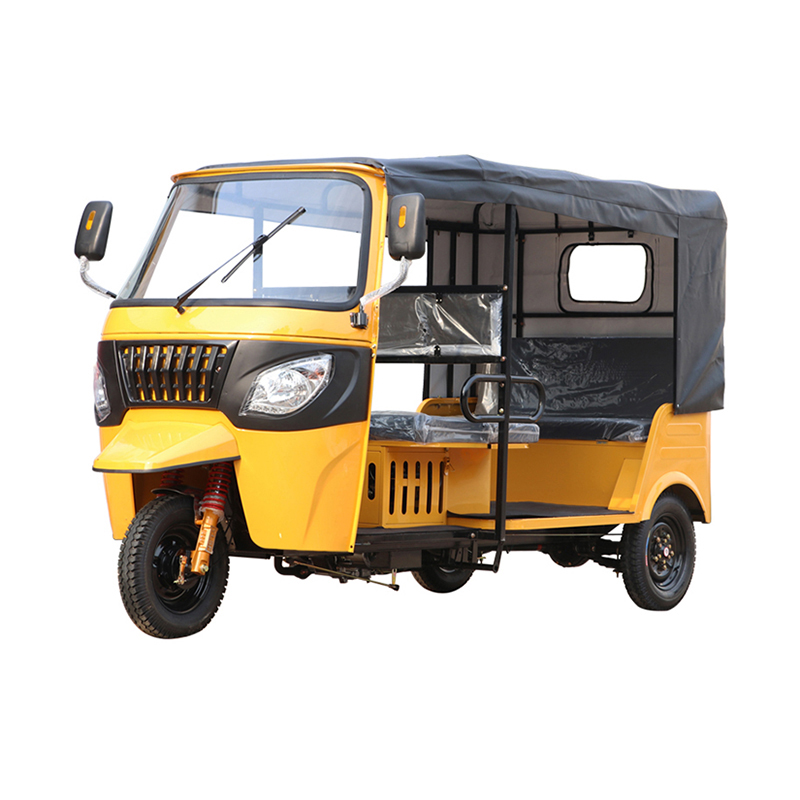
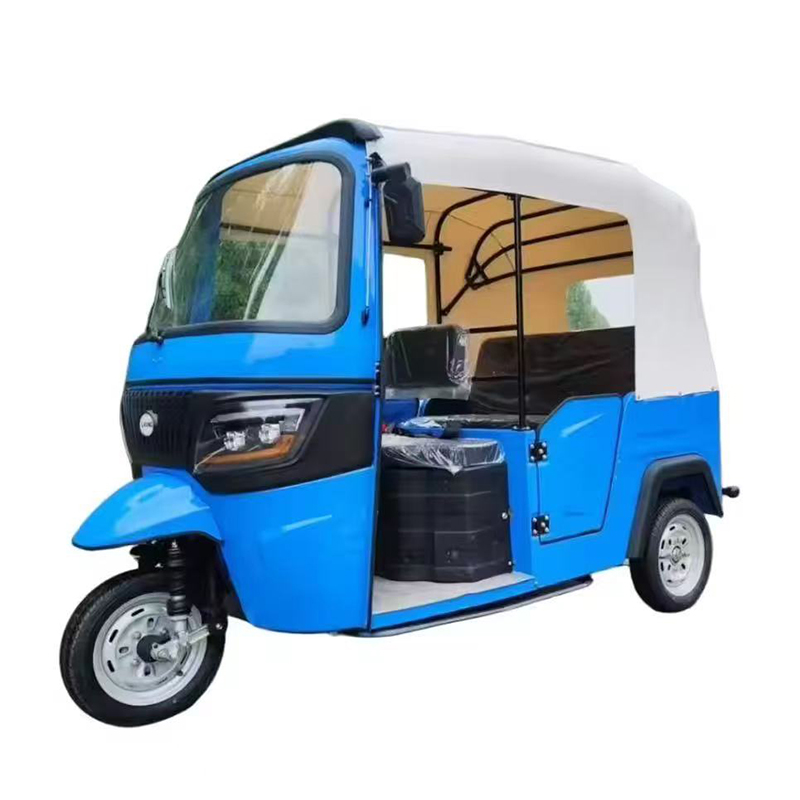
| Electric Tuk Tuk/Auto-Rickshaw | 3-6 seats | 60-120 km | City tours, narrow streets | $4,500 - $9,500 |
| Electric Tour Bus (Mini) | 14-25 seats | 80-150 km | Group tours, hotel shuttles | $25,000 - $60,000 |
| Electric Golf Cart Style | 4-8 seats | 50-80 km | Vineyard tours, campuses | $6,000 - $14,000 |
| Electric Open-Air Tram | 20-40 seats | 60-100 km | Scenic routes, national parks | $35,000 - $80,000 |
Selection should align with passenger capacity requirements, route characteristics (grades, surface type), and charging infrastructure availability.
3. Economic Analysis and Total Cost of Ownership
B2B buyers evaluating electric sightseeing vehicle investments must assess total cost of ownership across the vehicle lifecycle:
Acquisition Costs: Electric vehicles command 40-80% price premiums over gasoline equivalents. However, this gap is narrowing as battery costs decline (85% reduction since 2010 per BloombergNEF).
Operating Cost Advantages:
Energy Cost: Electricity at $0.12/kWh translates to $0.02-0.05 per km, compared to $0.08-0.15 per km for gasoline
Maintenance: Electric powertrains require 60-70% less maintenance (no oil changes, spark plugs, exhaust systems, or complex transmissions)
Longevity: Electric motors operate 15,000-20,000 hours before major service, versus 5,000-8,000 hours for internal combustion engines
TCO Case Study (Electric Tuk Tuk vs. Gasoline, 5-Year Horizon, 15,000 km/year):
Electric: $7,500 purchase + $2,250 energy + $1,500 maintenance = $11,250 TCO
Gasoline: $4,500 purchase + $9,000 energy + $6,000 maintenance = $19,500 TCO
Result: Electric electric sightseeing vehicle delivers $8,250 (42%) TCO savings over 5 years, with payback achieved in month 22.
4. Charging Infrastructure Planning
Successful electric sightseeing vehicle deployment requires strategic charging infrastructure planning:
Depot Charging: Overnight charging using standard 220V/16A-32A connections. Cost: $500-1,500 per charging point (equipment + installation)
Opportunity Charging: High-power DC fast charging (60-120 minutes) during midday breaks. Cost: $3,000-8,000 per fast charger
Swappable Battery Systems: Battery swapping in 3-5 minutes. Infrastructure cost: $10,000-20,000 for swap station (suitable for fleets 20+ vehicles)
Electrical Capacity Planning: A 10-vehicle fleet with simultaneous charging may require 50-100 kW electrical service upgrade ($5,000-15,000 utility upgrade cost)
For B2B buyers, engaging a qualified electrical contractor to assess site capacity and permitting requirements is essential before finalizing electric sightseeing vehicle procurement.
5. Environmental Impact and Sustainability Metrics
The sustainability advantages of electric sightseeing vehicle adoption extend beyond zero tailpipe emissions:
Gasoline sightseeing vehicle: 85-120 tonnes CO₂e (well-to-wheel)
Electric sightseeing vehicle (grid average): 40-65 tonnes CO₂e
Electric sightseeing vehicle (renewable energy): 15-25 tonnes CO₂e
Net Reduction: 50-85% depending on electricity source
Additional environmental co-benefits:
Noise Reduction: Electric vehicles operate at 50-60 dB vs. 75-85 dB for gasoline, improving visitor experience and reducing noise pollution in sensitive environments (national parks, historic districts)
Air Quality Improvement: Elimination of localized NOx and PM2.5 emissions, particularly important for enclosed or semi-enclosed tourist sites
Biodiversity Protection: Reduced noise and emission pollution minimize disruption to wildlife in eco-tourism destinations
6. Key Procurement Criteria for B2B Buyers
When selecting electric sightseeing vehicle suppliers, evaluate across these dimensions:
Battery Technology and Warranty: Prioritize LiFePO₄ batteries with minimum 5-year/2,000-cycle warranty. Verify warranty covers capacity degradation (typically 70-80% retention threshold)
Local Service Network: Assess supplier's service capabilities within 100 km of your operation. Remote support via telematics is valuable but cannot replace on-site service for major repairs
Customization Capabilities: Evaluate ability to customize livery, seating configurations, weather protection, and accessibility features (wheelchair lifts)
Regulatory Compliance: Verify vehicle certification for your jurisdiction (DOT, CE, CCC, or local equivalents). Non-compliant vehicles risk fines and impoundment
Resale Value Projections: Electric commercial vehicles are experiencing improving residual values as secondary markets develop. Estimate 25-35% residual after 5 years for quality brands
7. Implementation Roadmap
Successful electric sightseeing vehicle deployment follows a structured implementation sequence:
Phase 1 (Months 1-2): Needs assessment, site electrical audit, RFQ preparation, and supplier evaluation
Phase 2 (Months 3-4): Vehicle procurement, charging infrastructure installation, staff training
Phase 3 (Month 5): Pilot operations (2-4 vehicles), performance monitoring, SOP refinement
Phase 4 (Month 6+): Full fleet deployment, marketing launch (emphasize sustainability), continuous improvement
Frequently Asked Questions (FAQ)
Q1: What is the typical range of an electric sightseeing vehicle per charge?
A: Range varies by vehicle category and battery capacity. Typical ranges: electric tuk tuks (60-120 km), electric shuttles (60-100 km), and electric tour buses (80-150 km). Real-world range decreases by 15-25% in cold weather (0-10°C) and with heavy passenger loads or steep terrain.
Q2: How long does it take to charge an electric sightseeing vehicle?
A: Charging time depends on battery capacity and charger power. Using standard 220V/16A charging: 6-10 hours for full charge (overnight). With upgraded 32A charging: 3-5 hours. DC fast charging (where available) can achieve 80% charge in 60-90 minutes. Swappable battery systems offer "charging" in under 5 minutes.
Q3: Are electric sightseeing vehicles suitable for hilly terrain?
A: Yes, provided the vehicle is properly specified. Look for vehicles with adequate motor power (minimum 4-5 kW for 14-seat shuttles) and hill-descent control. Regenerative braking assists on downhill segments, recovering energy and reducing brake wear. Verify maximum gradeability specification (typically 15-30% for electric sightseeing vehicles).
Q4: What maintenance is required for electric sightseeing vehicles?
A: Electric vehicles require substantially less maintenance: battery coolant checks (annual), brake fluid replacement (every 2 years), tire rotation and replacement (every 10,000-15,000 km), and software updates (over-the-air or dealer-applied). No oil changes, spark plugs, fuel filters, or transmission service is required. Annual maintenance costs average $200-400 vs. $800-1,500 for gasoline equivalents.
Q5: Can electric sightseeing vehicles operate in rain or wet conditions?
A: Yes. Commercial-grade electric sightseeing vehicles carry IP54-IP65 ingress protection ratings, meaning they are resistant to dust and water jets from any direction. Most manufacturers recommend avoiding deep water (exceeding 150-200mm depth) to protect undercarriage components. Always verify IP rating before procurement if operating in heavy rain or flood-prone areas.
Conclusion
The electric sightseeing vehicle represents a strategic convergence of environmental responsibility, operational efficiency, and market differentiation. For B2B buyers in the tourism and hospitality sectors, the evidence is compelling: total cost of ownership advantages of 30-50% over five years, substantial emission reductions aligning with corporate sustainability commitments, and enhanced visitor experiences through quiet, clean operation. As charging infrastructure matures and battery technology advances, the business case for electric sightseeing vehicle adoption will only strengthen. Procurement decision-makers who act decisively now position their organizations at the vanguard of sustainable tourism while realizing measurable financial returns. The transition to electric sightseeing vehicles is not merely an environmental imperative—it is a strategic business opportunity.
References
MarketsandMarkets. (2023). Electric Low-Speed Vehicle Market - Global Forecast to 2030. Northbrook: MarketsandMarkets Research Private Ltd.
United Nations World Tourism Organization (UNWTO). (2022). Tourism and the Sustainable Development Goals - Journey to 2030: Transport and Mobility. Madrid: UNWTO.
Booking.com. (2023). Sustainable Travel Report 2023: How Travelers are Embracing Sustainability. Amsterdam: Booking Holdings Inc.
BloombergNEF. (2023). Battery Price Survey 2023: Lithium-Ion Battery Pack Prices Rise for First Time to $151/kWh. London: Bloomberg Finance L.P.
Weinberger, R., Sevtsuk, A., & Mejia-Dorantes, L. (2021). "Electric vehicles for sustainable tourism: A review of adoption drivers and policy implications." Journal of Cleaner Production, 310, 127423. https://doi.org/10.1016/j.jclepro.2021.127423
Renqiu Xianyue Motorcycle Co., Ltd.
Copyright © 2026-2027 https://www.xuanyuetricycle.com. All Rights Reserved Renqiu Xuanyue Motorcycle Co., Ltd.